ISSN 2379-5980 (online) DOI 10.5195/LEDGER.2023.289
RESEARCH ARTICLE
Irrational Economic Action: Running a Bitcoin Lightning Node for Negative Profit
Edward Gotham*
The market for routing is near-perfect in terms of internal competition, but sub-optimally arranged. Operating losses that many node operators face appear to be rationalized as a “fiat only” loss, node operators exist within a Bitcoin-only profit paradigm. Computing the actual fiat profit margin is not possible, due to insufficient data regarding the average fiat cost of the bitcoin deposited to provide routing liquidity.
![]()
* E. Gotham (edgotham@pm.me) is corresponding author, Feng Chia University, Taichung, R.O.C.
![]()
From the outside looking in, Bitcoin is a tangle of communities, computer code, racks of equipment in people’s basements, and a perplexingly large amount of stored wealth. Finding the initial thread to untangle “the Bitcoin ball of yarn” is challenging for the uninitiated. Despite a growing body of highly technical research, it is likely that the vast majority of information regarding Bitcoin is not written up in academic literature. One notable exception to this is a technical paper published last year by Béres, Seres, and Benczúr,1 which describes the economic irrationality (perhaps financial irrationality may be more precise) of running a Bitcoin Layer 2 Lightning node. Lightning nodes offer increased transaction speeds and reduced transaction costs for Bitcoin, compared to the initial blockchain that was initiated in 2009. This apparent irrationality indicates some other factor is at work, so an experiment was conducted.
This paper is intended as an exercise in economic anthropology, as the author attempts to go from very little knowledge of Bitcoin, to initiating and maintaining a median scale node on the Bitcoin Lightning Network. In economic terms, irrational behavior is not always as simple as bounded rationality or poor time preference. Many individuals in the Bitcoin ecosystem appear intelligent, passionate, and dedicated to system development, which implies that their collective irrational behavior is an indicator of some hidden utility that they purchase with their labor and capital.
In July 2010, an individual using the pseudonym Satoshi Nakamoto wrote, “If you don’t believe me, or don’t get it, I don’t have time to try and convince you, sorry.” At the time, this comment addressed complaints about Bitcoin’s transaction speed and inability to scale.2 The comment is now a well-worn trope of the Bitcoin community, but 13 years later, it partly describes why Bitcoin continues to receive so little financial and economic research attention. The various groups and individuals developing Bitcoin are busy developing it, and with a few exceptions, such as training people to code, or operate and build the network, they seem to pay little attention to how the system functions fiscally or economically. With nations such as El Salvador adopting Bitcoin as dual tender, it is becoming necessary to model and understand this economic and incentive framework.
Currently there are two functional layers to the Bitcoin network: Layer 1 (L1), the blockchain, and Layer 2 (L2). The Lightning Network (LN) is the current primary L2 solution, though others are in development. Both L1 and L2 qualify as payment channel networks (PCNs). The increasing stability of L1 led to rapid growth in L2, but as described by Béres, Seres, and Benczúr (2021), Ersoy, Roos and Erkin (2019) and others, 1, 3 the vast majority of L2 operators appear to be running at a financial loss. Equally perplexing is the fact that during the 2021 price peak, Bitcoin’s market capitalization was around $1.263tn, and by June 2022 this had declined to $361.14bn, representing a large sell-off in the underlying asset; yet L2 continued to grow. In terms of labor and capital costs, this is a large number of highly skilled people that could be doing other paid work, who are collectively engaging in irrational financial behavior and then locking in their loss.
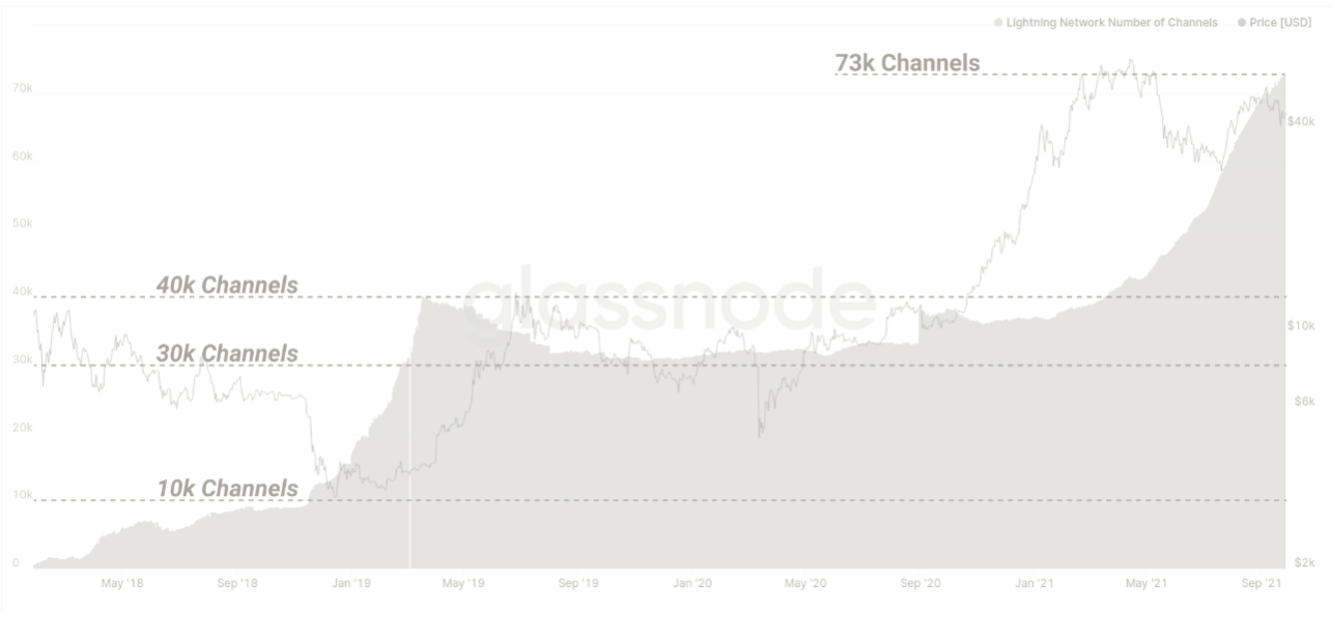
Fig 1. Growth in LN channels 2018–2021.4
One way to measure the utility of a PCN is the number of transactions it can manage in a given time. For, example Visa is capable of completing 47,000 transactions per second (TPS). Bitcoin L1 is limited to some number between 7 and 27 TPS, depending on who you ask, on a given day.5 This is why the L2 solution for a system like Bitcoin is fundamental to scaling, because L1 transactions may take 1 hour to be confirmed, but L2 payments are near-instant and cost fractions of a USD cent. One of the reasons Bitcoin L1’s transaction speed is limited is the mempool(s) where transactions wait to be recorded. If there are too many transactions in the pool, then fees increase so that the payments are priority ranked. Prior to L2 deployment, increased mempool fees indicated increased Bitcoin use, and reduced activity implied reduced use. Reduced activity in the L1 mempool pool over the period 2020–2022 made it tempting to assume that “Bitcoin was dead” again;6 however, Divakaruni and Zimmerman (2022) showed that Bitcoin as a means of value transmission did not reduce. Instead, transactions migrated to L2, where operations were faster and cheaper.7 Controlling for lower usage following the USD value losses, Zimmerman (a research economist at the Federal Reserve Bank of Cleveland) showed that Bitcoin usage actually increased over the period studied. Examined another way, in 2021 the Bitcoin network transmitted an average value of $489bn per quarter, whereas PayPal only processed $302bn. Currently these transaction values are significantly less than MasterCard ($1.8tn) and Visa ($3.2tn),8 but they continue to grow. This means that in a period of economic hardship for the Bitcoin ecosystem, irrational economic behavior, as measured by labor and capital, increased.
The current Bitcoin on-boarding process is not difficult as it was 10 years ago, and after some investigation, this researcher discovered that many aspects of the system can be described using economic models that have existed for 50 years or more. It is true that key technical aspects of the underlying system are alien to traditional finance—for example, there are no parallels to unspent transaction outputs (UTXOs) and hash time-lock contracts (HTLCs)—but the way in which these devices function can be explained by analogy, and almost no technical knowledge of them is required to understand the node market.
The first ten years of Bitcoin research primarily falls into three categories, (i) a technical analysis of price, with back-tested regressions to determine a correlation with asset x or y, (ii) some examination of legal issues, or (iii) highly technical aspects of the code or mathematics, many of which are inaccessible to readers that lack a strong background in computer science. Recently, the field of Bitcoin literature has expanded rapidly. Though field-wide numbers are hard to come by, multiple bibliometric analyses attest to a growth from hundreds of papers in the mid-2010s to 4,000-5,000 today.9 With regard to the LN specifically, until about 2020 the entire “body of literature” consisted of less than ~50 papers, mostly published at computer science conferences. There were several reasons for this: the LN is a new system, and poorly understood by people not actively involved with it; the degree of cross-specialization required to write such papers from an economic perspective has not developed sufficiently; and the developmental aspect of the LN protocol makes some research out of date within just a few months. The number of papers on the LN has begun to grow recently, but the majority still only exist as pre-prints or early conference proceedings. Future researchers should note that at the time of writing, it is easier to follow specific authors, rather than topics, as a few key names are driving the field.
Table 1. Date-ordered papers considering economic perspectives of the Bitcoin LN.
Author / Date | Title | Summary |
Jun Ren et al. (2018)18 | Optimal Fee Structure for Efficient Lightning Networks | Describes the relationship between minimum and average path length and how channel balance affects routing decisions. |
Di Stasi et al. (2018)10 | Routing Payments on the Lightning Network | Proposes a general way for nodes to apply fees to keep channels balanced, also develops a new multipath routing system using atomics. |
Guo et al. (2019)20 | A Measurement Study of Bitcoin Lightning Network | Presents a full network graph, payment routing success rates, and analysis of the degree of network decentralization. |
Ersoy et al. (2019) 3 | How to Profit from Payment Channels | Describes the profitability problem of LN routing nodes. |
Khan and State (2020)11 | Lightning Network: A Comparative Review of Transaction Fees and Data Analysis | Examines scalability and throughput issues, drawing comparisons with Raiden, Stellar, Bitcoin and conventional PCNs. |
Pedrosa et al. (2019)19 | Scalable Lightning Factories for Bitcoin | Describes the need for scalable nodes and security. Concludes that scalable LN factories may be required. |
Tikhomerov et al. (2020)12 | A Quantitative Analysis of Security, Anonymity and Scalability for the Lightning Network | Primarily addresses security issues and potential attack vectors, IT oriented, also covers routing issues relating to insufficient channel liquidity balances. |
Bartolucci et al. (2020)13 | A Percolation Model for the Emergence of the Bitcoin Lightning Network | Characterizes the network phase diagram showing minimal volume of transactions required to make LN sustainable for a given level of fees (or, alternatively, maximal cost it may impose) for a given average volume of transactions. |
van Engelshoven and Roos (2020)22 | The Merchant: Avoiding Payment Channel Depletion Through Incentives | Examines payment path optimization, channel liquidity management and ways to on-board merchants. |
Béres et al. (2021)1 | A Cryptoeconomic Traffic Analysis of Bitcoin’s Lightning Network | Estimates channel structures and pricing in response to traffic, examines examples of nodes that operate in an economically viable manner. Shows that traffic or transaction fees need to increase to make routing economically viable. |
Lin et al. (2022)14 | The Weighted Bitcoin Lightning Network | Uses Bitcoin LN data from January 2018 to 17th July 2019 to construct a weighted model of growth and centrality. |
Zabka et al. (2022)15 | Empirical Evaluation of Nodes and Channels of the Lightning Network | Conducts an analysis of the network node structure, describes how to obtain primary level information via gossip, incl. node geographical location (via IP). |
De Silva et al. (2023)16 | Profitable Fee Controller for Payment Channel Networks | Reveals a novel fee-controller design to optimize maximum profit, while warding-off channel exhaustion, by implementation of a dynamic fee mechanism. |
Hong et al. (2023)17 | Auto-tune: An Efficient Autonomous Multi-Path Payment Routing Algorithm for Payment Channel Networks | Presents system modeling techniques, path optimization strategies and privacy enhancements. The author’s model is compared with current solutions. |
Guasoni et al. (2023)31 | Lightning Network Economics: Channels | Identifies optimal channel settings, shows explicit formulae for channel costs, and demonstrates the implied blockchain decongestion. |
For LN papers, the “technical and feasibility” approach still dominates, though some come close to a business or economic analysis. Jun Ren, Feng, Cheong and Meng Goh (2018) examined empirical data on LN transactions, beginning with the assumption that transactions always took the path using the lowest aggregate fees.18 They discovered that it is not possible to simultaneously have short average path lengths and low overall channel balances. This discussion was from December 2018, but it shows that LN balance and liquidity issues have persisted for nearly 4 years. Their conclusion was that fees should be proportional to the square root of the channel capacity (the meaning of these LN terms is explained in the following section). Pedrosa, Potop-Butucaru and Tucci-Piergiovanni (2019) proposed scalable LN factories, where organized channel management would take place; 19 however, the paper primarily focused on digital signatures and the malicious actor problem, and not on business or economics. Using long-run (15 months) observations, Guo, Tong and Feng (2019) studied the LN, examining channel characteristics and application performance.20 They showed payment routing success rates and the degree of network decentralization, along with new information about network transaction mechanisms, however they did not address node operation as a business.
The earliest paper on the profitability of node operations was by Ersoy, Roos and Erkin,3 however their paper was published in 2019, at a time when the entire network topology was known, and their model also assumed rational actors seeking to profit maximize. If so-called “dark tetrad” personality traits really are overrepresented in cryptocurrency users, as some authors suppose, then perhaps this may explain some of the irrational behavior. 21 Van Engelshoven and Roos (2020) described various ways of optimizing payment paths, but this was a technical approach to the topic, and less to do with profitability in an accounting or financial sense.22 Most recently, Béres, Seres and Benczúr (2023) showed that the LN provides little to no financial incentive for payment routing, specifically stating, “the existing fees do not sufficiently compensate the nodes that essentially hold the network together.”1 This raises the question, what are node operators purchasing in return for their time and capital?
Instead of a technical and computing approach, this paper introduces the LN as simply as possible, so that the market and need for a market become clear. It then describes some basic aspects of the LN market structure in 2022. Following this there is a brief look at the income and expenditure model of a node operator, and the conclusion section addresses some factors that may be contributing to the sustained growth of the network which run contrary to a node operator’s personal financial interests.
In 2015, Bitcoin’s L2 solution was proposed, to remedy the lack of speed and scalability of the L1 main chain.23 Bitcoin’s L2 network functions by connecting a large number of privately owned and operated nodes, which all host an entire copy of the L1 blockchain. As with Bitcoin L1, L2 market participants are self-selecting. Relative to the price of Bitcoin mining, nodes have very low minimum hardware costs, and the current cost to operate (not fund) a node is in the low hundreds of USD (as opposed to mining, which is in the low thousands of USD). L2 achieves speed and certainty of transaction by connecting a large number of smaller nodes and “sharing” the L1 security system. The primary business operation of a node operator is supplying capital to transmit other user’s payments. The node operator must purchase Bitcoin, then deploy it to a node, which offers it to the network as a visible source of locked liquidity. Bitcoin liquidity that is stored on a node behaves similarly to water in a hydraulic pressure system: the local bitcoin never leaves the node, it only transfers a record of “payment pressure” from one place to another.
The LN officially entered operation in 2017 and is still undergoing development (at time of writing: Nov 2023: lnd_v0.17.0-beta, or cln_v23.08.1: Satoshi’s Successor II). By March 2022, the LN held ~₿3,500, by June 2022 that had increased to ~₿4,000, in March 2023 this had grown to ~₿5,300. A node operator sets up a node by downloading the complete Bitcoin blockchain and synchronizing it with the network. The operator then creates a new LN wallet, and sends Bitcoin to that wallet from the main blockchain. Once the LN wallet has been funded, the operator can open channels to other nodes. Connections between nodes cannot be refused, as long as they meet the publicly visible conditions set by the node operator. Node performance is public information, and factors such as liquidity level, number of channels, uptime and other metrics are all considered when operators choose to establish a connection. More details on partner channel selection are covered in section 5.2.
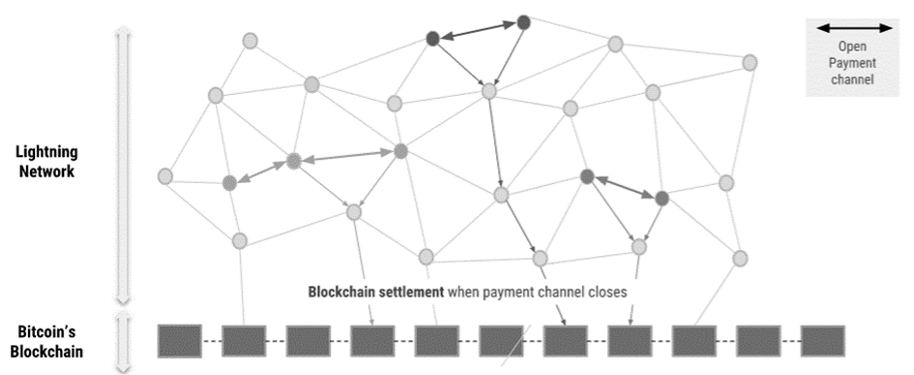
Fig 2. Simplified overview of Bitcoin Layer 1 and Layer 2 connectivity, diagram per B. Obondo (2018).24
The LN is a locked-liquidity mesh network that uses thousands of nodes to decrease the work done by the main blockchain. Bitcoin is moved (suspended) from the main chain to L2 by creating a UTXO, which is similar to a receipt. UTXOs are an oddity of the way Bitcoin functions that has no parallel in traditional finance. In this context, it can be considered a form of escrow, which only that L2 node can access, but others can see. Bitcoin payments are measured in Bitcoin (₿), Satoshis (Sats) or mSats; where ₿1 = 100,000,000 Sats, and mSats are 1/1000th of a Sat. The smallest fee division is measured in parts per million (ppm). Currently mSat divisions and ppm are only used by node operators for fee calculations; conventional user wallets do not support this level of granularity. To establish a mental frame of reference, and using round numbers for simplicity, where ₿1 = $100,000, 1 Sat = $0.001, therefore 1 mSat =< $0.000,001.
Where multiple users are connected to the same node, payments occur almost instantly, and at zero or close-to-zero cost. Where users are not connected to the same node, the payment instruction must hop (be routed) from node to node until it reaches its destination which may take ~3-30 seconds. Each node charges a fee, similar to tolls on a road, and some nodes charge no fees. To be able to transmit a payment, a node must have sufficient liquidity, and this is one of the reasons why nodes broadcast their liquidity information. All or part of the node’s available liquidity is locked into one-or-more payment channels. Node channels have a local and remote side, and this is the reason why one common analogy used to describe a LN node is the abacus. Funds do not actually leave the node, but beads (Sats) are moved from side-to-side on a series of connected abacuses (nodes), that only record the net channel balance. When a node operator wishes to withdraw liquidity (settle funds to L1), they close the channel, and then close the UTXO (escrow account) on L1.
Node operators, then, provide liquidity, and charge a fee for use of their channel. This fee is paid whenever that node and channel is used for a payment, which leads to an outcome where node operators seek to maximize traffic through their node, but do so by minimizing fees. For various reasons, this is a multi-factorial problem, and is not easily resolved by a Lagrangian maximization. Pickhardt and Richter (2021) are currently the closest to finding an optimized solution.25 Furthermore, it is not possible to set all fees on a node to zero, then automatically obtain all payment flows, because there are issues related to (node) distance, fees charged by connected peers along the payment path, and liquidity.26 The net liquidity of the node must also remain somewhat balanced.
Figure 3 presents a simplified hypothetical node, where a Bitcoin wallet with ₿50 has been used to provide ₿36 in liquidity to a node, creating Peer 0. ₿14 in liquidity is retained on L1. In this example, node liquidity is fully utilized and distributed across 5 channels, though some liquidity can be kept in reserve if required. Node channels do not need to be equal in size, as this enables the liquidity to go where it is needed. Channel sizes in Fig 3 are drawn to scale, such that Channel 1 shows a balanced local/remote channel, with ₿4 on the local side, and ₿4 on the remote side (Peer 1). This means the channel could support a payment of up ₿4 in either direction, but using the full amount would drain the channel. Channel 2 is another ₿8 channel but this time the balance is skewed toward the remote side (Peer 2), as more payments have been pushed in that direction. Channel 3 is relatively small compared to the others, and could be connected to a hobbyist or friend. Channels 4 and 5 are larger, and from the perspective of Peer 4, Peer 0 might be considered a “liquidity drain.” Channel 5 is the reverse situation, and Peer 5 is the drain. Several details of the LN system such as channel reserves, anchors, locked channels, and forced closes are purposefully omitted here, to focus on the principles of the system.
Other aspects of node operation include personally making payments. In this situation, a user must deposit sufficient on-chain funds to open a channel. For example, if a user opens a ₿10 channel (in one direction only), all the capacity will be on the local side. If this is the user’s only channel and they make an ₿8 payment, they will be able to receive up to ₿8 in payments in return, via that channel; however, they would be limited to making up to ₿2 in payments until they receive inbound payments through that channel. If a channel is only funded on one side, then a payment must first be made, in order to receive a payment. This is the reason that many channels are opened in a “dual funded” state, and also shows why triangle swaps and Rings of Fire (described in Section 6) are popular ways of obtaining inbound liquidity.
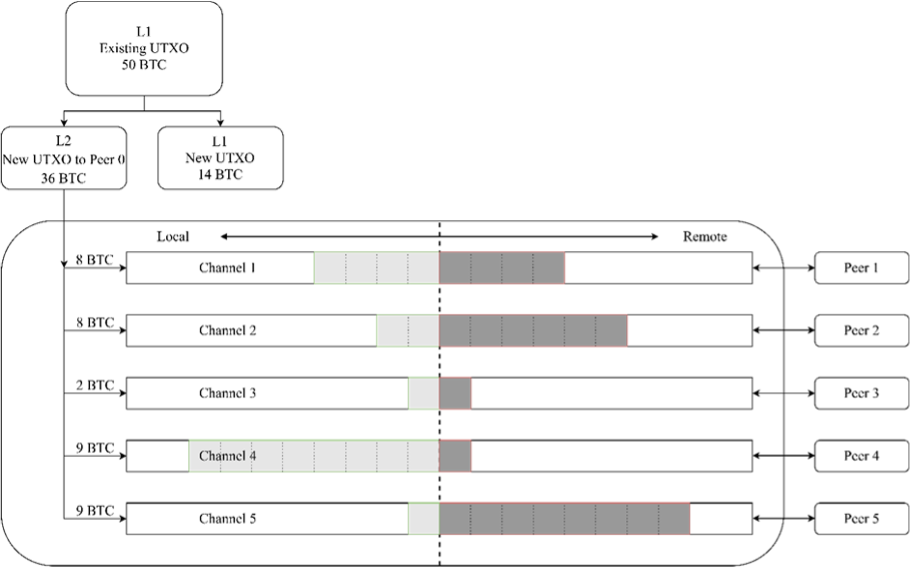
Fig 3. L1 and L2 interaction, and hypothetical channel balance.
Where payments flow excessively in one direction, a channel can become drained of liquidity and rebalancing is required. This situation is common where a store owner operates a node and experiences greater inbound liquidity, as people exchange Bitcoin for goods and services. A node connected to a store may experience excessive outbound liquidity as it routes payments toward the store. Closing and opening channels involves a L1 network fee, which may or may not be offset by income earned by routing.4 When all payment routing is complete, the node operator is able to settle funds back on the L1 chain. None of the transactions that occurred are recorded, only the net balance.
Node population has so far seen two rapid increases, first in 2019, and then in 2021. This means that many new node operators have recently entered the market. In 2019, there were hardly any technical papers or supporting literature, and progress was made by means of a few blog articles,27 the original Lightning Network wiki, and several online chat support channels. As technical support has grown, so has the network. Market structure is closely related to degree of centralization, and Divakaruni and Zimmerman (2022) observed that counterparties were more likely to connect where payments could be routed at the lowest cost;7 however, competitive forces (primarily price) currently prevent the network from becoming too centralized. The four fundamental market structures and their applicability to node operators are presented in Table 2.
Table 2. Lightning Network Market Structure.
| Perfect Competition | Monopoly |
|---|---|
| ✓ Large number small firms | ✗ Single dominant firm |
| ✓ No control over price | ✗ Significant control over price |
| ✓ Homogeneous product | ✗ Produces and sells unique product, no close substitutes |
| ✓ No (or very low) barriers to entry | ✗ High barriers to entry |
| ✓ Perfect information | |
| Monopolistic competition | Oligopoly |
| ✓ Large number of firms | ✗ Small number of large firms |
| ✗ Substantial control over market price | ✗ Significant control over price |
| ✗ Product differentiation | ✗ Firms are interdependent |
| ✓ No (or very low) barriers to entry | ✗ Differentiated or homogeneous products |
| ✗ High barriers to entry |
The lack of research on LN so far has led to a lack of decided-upon metrics. For example, Figure 1 shows the growth in number of channels, but as previously stated, one node can host many channels. Some larger nodes may host hundreds of channels, whereas a smaller hobbyist (median tier) likely only hosts a dozen. The reason for this is that some the nodes are intended for routing, whereas others are for personal use, and still others are a hybrid of the two. Furthermore, individuals may run more than one node, one for personal use, and another for routing. The total number of LN nodes is currently ~17,700, with ~85,000 channels, so the average number of channels (bi-directional) per node is ~5, but this value is misleading.28 L2 information is broadly accurate, but was more accurate in the past when the network was smaller, and it must be “read” correctly. Information availability is affected by the connections visible to neighboring nodes, through a system known as network “gossip.” The websites Amboss.space, bolt.observer and 1ml.com are generally regarded as the most authoritative sources of free L2 information, but data from these sites varies because of “network perspective.” For example, Amboss aggregates the various data, and plots the differences visually for users. Glassnode.com and Amboss are now beginning to operate subscription models to monetize their data. Another misleading factor regarding node population, is the average node capacity, currently ~₿0.257, and average channel capacity ~₿0.052. Several large node operators (Table 3) skew this data upward, so the median channel value ~₿0.013 is more informative.29 Examining the data further, 95% of nodes have a capacity of up to ₿0.52, whereas the top 1% of nodes provide more than ₿3.92 in liquidity. This means that there are a small number of large, well-connected nodes, with a large number of smaller nodes orbiting them. There are a number of LN visualizers that attempt to show a live view of the LN topology, but as described, these are often incomplete, and should only be considered a representation of the network, not an actual diagram. Figure 4 is one example of a simplified network map,28 showing only larger nodes, because a full network map when printed resembles a dust cloud. During this research, it became apparent that researchers will need to establish a lower bound for nodes to see inclusion in the data, because systematically removing the outliers will be of increasing importance as the network grows. The large number of tiny nodes, likely for testing purposes only (like the author’s), interferes with findings. For example, removing nodes below median capacity could filter personal-use nodes from routing nodes. Using bolt.observer, when the total network population was N = 17,697; removing nodes below ₿0.005 capacity left n = 10,028.
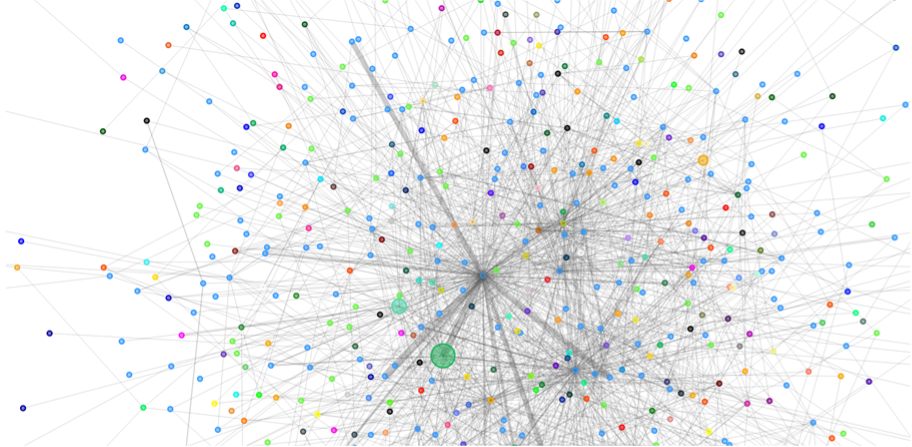
Fig 4. LN visualizer tool available at https://1ml.com/visual/network.
On the other end of the distribution, Table 3 shows the ten largest node operators on the LN at March 2023. This ranking may have changed over the last 6 months, but the distribution pattern remains consistent. These would be considered the monopolists in the market and several are owned by the same entity, e.g. Bitfinex (bfx), ranked 1 and 3, River Financial ranked 4 and 6. Expanding the table to include the top 30 nodes shows a similar pattern. This means that in March 2023, when the network held ~₿5,392, the ten largest nodes had a collective capacity of ~₿3,535.671 (~65.5%).
Table 3. Top 10 LN nodes March 2023
Rank | Alias | Capacity (Sats) | Number of Channels |
1 | bfx-lnd0 | 86,418,635,298 | 1,141 |
2 | ACINQ | 49,675,037,942 | 2,452 |
3 | bfx-lnd1 | 45,126,215,046 | 811 |
4 | River Financial 1 | 35,324,236,795 | 398 |
5 | Kraken 🐙⚡ | 31,465,270,863 | 1,372 |
6 | River Financial 2 | 26,502,335,420 | 254 |
7 | ln.nicehash.com [Nicehash] | 20,037,908,745 | 1,381 |
8 | Bitrefill | 19,519,653,188 | 505 |
9 | WalletOfSatoshi.com | 19,136,063,402 | 2,486 |
10 | LNBiG.com [lnd-22/old-lnd-12] | 14,590,190,380 | 591 |
This puts the market situation somewhere between perfect competition, where entry costs are low, with many firms; and monopolistic competition, where a small number of larger firms are offering higher liquidity, but not willing to commit excessive funds to the network. The reason larger businesses are probably not offering more liquidity would be the opportunity cost of locking up that capital, and the low returns due to the high number of smaller node operators running at close to zero cost.
Balance sheet operations for a median-size node can be categorized into net initial costs, net running costs, and net exit costs. For simplicity, shutdown and exit costs are considered together, as the entire process is almost costless and takes less than 1 hour. The potential income and expenditure factors are presented in Table 4. For the electricity cost computation, a median US value was used, and for a frame of reference, the device used in this study (Raspberry Pi 4b 8GB) runs on a power supply equivalent to a smart-phone charger from 2021.
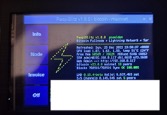
Setup—There are no services that can be offered during setup, but with the required knowledge, and capital for liquidity, a node can be operational within a few hours. A node capable of operating at the median values described in Section 3 can run on very low hardware requirements such as an old laptop, but a common solution is the Raspberry Pi (4b 8GB). Some off-the-shelf nodes (Umbrel, Start9 - Embassy) are also based on the Pi, but for this study the device was built from scratch following the Openoms GitHub instructions.30 Images of the operational device are presented in Figure 5. This tier of operation fits the median node description, and it should be considered highly likely that commonalities in the hardware being used are what currently defines the median node capacity. The low hardware requirements also mean that older hardware can be repurposed, however older motherboards may have difficulty with the continual up-time required.
Table 4. LN node operation costs (open and close channel data accurate at Dec 2022).
| Income | Expenditure |
|---|---|
| Startup | |
| Hardware: $300 – $3,000 (potentially zero). | |
| Initial training Time: 10-40 hrs. | |
| Bitcoin liquidity: To open 5 channels, each equal to the current median channel value ₿0.013 × 5 = ₿0.065 | |
| Cost at 1 yr USD high (68,906.48) = $4,478.92 | |
| Cost at 1 yr USD low (17,614.34) = $1,144.93 | |
| Running | |
| Base Fee: Current median value 0.945319 Sats | |
| Sats/vByte: Current median value 0.000028 Sats | |
| Offering excess liquidity: Cost of capital +~1-3% | Liquidity purchase: Cost of capital +~1-3% |
| Channel Rebalancing: 1 – 2k Sats | |
| Electricity: (3W × 24 hrs × 365 days) / 1,000 = 26.28 kwh consumption | |
| 26.28 × 11.18 c = 293.8104 c = $2.93 p.a. | |
| Shutdown / Exit | |
| Channel close: ~2k Sats | |
| Close all channels: ~10k Sats | |
Operation—Once the hardware is assembled, and after some troubleshooting, the downloaded software packages (Raspiblitz v.1.7.9) can be written to a micro SD card and the device is powered on for the first time. The node will begin to synchronize with the L1 network. The user will be prompted to provide various passwords and then record their seed words to protect the device. The initial L1 synchronization may take some time as it downloads ~550GB of data. L2 synchronization cannot begin until the L1 synchronization is complete, but L2 does proceed more quickly. Restarting the device after several weeks routing payments may take some time on low power devices, especially if there are many open channel states to process.
In terms of production (goods and services), there are only two services a node operator can offer: (i) routing services and (ii) provision of liquidity to other node operators. Routing income is derived from charging a base fee (mSats) and a scale based fee (ppm). These fees are almost unimaginably small in USD values and would rarely cover any operational costs. The primary difference between professional and median tier nodes is the number of channels that the hardware can support. With smaller standalone units, similar to the one shown in Figure 5, there is some risk to capital in the event of a catastrophic drive failure, which is likely another factor that leads to the definition of the median scale node and channel size. As more payments pass through a node, it needs more liquidity, more power (electrical and processing), and more maintenance, raising costs. This puts larger, more commercial, nodes at an advantage because they already have access to higher grade hardware, failsafe mechanisms, and they do not have to bootstrap their service.
To begin providing routing services, the user researches potential channel partners, and begins opening channels. This is the area of operation where experience and social network support can prevent costly errors for new operators. Channel management is sufficiently complex that it deserves its own paper, and the decision criteria for channel management have not been fully mapped. However, from a high level, channel management has several obvious domains: (i) partner node selection, (ii) channel size, (iii) rebalancing, (iv) pruning, and (v) yield. In partner node selection, operators consider partner liquidity, and partner node secondary connections. If you and a partner node share many of the same channels, then there is little benefit to opening a channel. For channel size, smaller channels reduce the chance of unused liquidity, but if a channel is too small, it may become drained and need constant rebalancing, or it may fail to be used as a route because the balance is too low. At the current time there are still no tools to expand an existing channel, but they are being investigated. Avoiding the main chain is a significant part of channel management, and a large part of node profitability is concerned with rebalancing tools such as LOOP, which is effectively pushing Sats to oneself through other people’s closely connected nodes. This reduces the need to frequently close and reopen a channel which incurs an L1 cost. Pruning unused channels is necessary to ensure that channel liquidity is being used, but there are downsides, as user reports suggest (and the author confirms) that some channels sit dormant for long periods, then suddenly experience a rush of activity. The pruning aspect ties in closely to the initial partner node decision. With respect to channel yield, the first literature is now beginning to emerge on this topic, and Guasoni, Huberman and Shikhelman recently published a paper on the economics of LN channels.31 However, private enterprises are already producing far more specific network analysis and yield tools. For example, Amboss hosts a liquidity marketplace, and this gives them access to unique market- making information on user inbound liquidity purchases. In this case, the channel yield is determined by price, duration, and size. This data has been further extrapolated to create a form of metric Amboss refers to as the Lightning Network Rate (LINER), which is the closest thing the LN currently has to an established APR estimate for users, when assessing channel profitability.32 Recent developments such as these inbound liquidity purchases influence data that researchers use when attempting to analyze the raw network data. Just as L1 now has out- of-band payments, L2 now has a secondary market place. Many node operators do not read what passes for the LN academic literature, and instead rely on the tools and real-time metrics when hunting for suitable channels, these include Amboss.space, bolt.observer, 1ml.com and mempool.space.


(a) Left side (SD card port). (b) Right side (Cat 5e ethernet and USB bridge leading to SSD.

(c) Top (Pi heat vent and display). (d) Touch panel / OS header.

(e) Front (Standard 3A 5v USB-C power). Fig 5. (a) – (e). Node used during this experiment.
In terms of observable experience, this researcher found that channels would often remain unused for some time, then increase gradually in use, which may or may not lead to a flood of payments. There were also situations where a channel would suddenly drain completely overnight. Where fees were set too low, liquidity drained rapidly as information about that low fee rate propagated across the network. Common advice on preventing this phenomenon was to set fees high initially, then reduce them gradually, observing how traffic across the node changes. The age of the node and health of its channels is also an important factor. Reliability and connectivity (up-time) is also a factor affecting which nodes other operators will connect to.
Return on labor as an input is one way to increase the return on node channels, as this is an information-based factor of production, but where some businesses are intentionally (or sometimes unintentionally) operating at-or-below average total cost, there is only a certain amount that can be achieved. In this respect, businesses charging a zero-fee rate, if competent and reliable, are assisting the network by keeping flows high and costs low; however, if the node is poorly managed and underpriced, then there is a risk they may be pricing more competent node operators out of the market.
Shutdown—Shutdown is a simple procedure and involves a small cost measured in Sats. Channels close and funds return to the L2 wallet. Some closes can be instant, whereas others may take up to two weeks if a node is “delinquent” or offline for some unknown reason. When all funds are settled on L2, they can then be returned to L1 if the operator decides there are no desirable channels to open. After market exit, there would be little use for the left-over hardware as the minimum specification is so low. For a professional-scale node operation, the servers would probably already have been dual purpose or rental.
The basic nature of node business operations on the Bitcoin Lightning Network was discussed. Node operation was described using standard economic theory, and it was shown that the LN market for wealth transfer is close to perfect competition. This should be expected to change over time as larger firms enter the market and begin to optimize services or offer a differentiable product. The entire L2 market structure fits entirely within a much larger PCN market, which includes central banks (e.g. Corda, Fabric and Besu Hyperledger), local banks, and other regulated firms. It is unclear whether the internal perfect competition of the LN market will make the system resilient enough to compete externally with legacy payment systems.
Some L2 businesses open low value channels to other users, or undercharge on routing fees. In a strictly rational sense, this is problematic for the network, as it contributes to the “price of anarchy” problem described by Pickhardt.26 This explains why centrality is a key indicator for a node’s importance in the network and why new node operators engage in community building activities that improve their node’s reputation. This reputation mechanism is also a device which builds the community effect, encouraging triangles or rings-of-fire (RoF). These usually consists of 5 nodes, where one operator opens a channel to the next in a clockwise manner. All the channel sizes are pre-agreed and the fifth node links back to the first. Creating rings like this means the network is more distributed, because new nodes are generally only funded from one side when they open. These ad hoc agreements arise from conversations in online chat groups and involve some degree of trust. Users of these groups have specific channels where downtime for servicing and other updates about their node are shared. Routing through the node shown in Figure 5 produced very sparse data, so much so that it is not worth reproducing here. This was due to a number of factors already described: connectivity, up-time, node reputation, and channel size.
Limitations and Further Research—During the writing of this paper, it became apparent that several factors would prevent discovery of the causes behind the apparently irrational behavior. First, the distributed network is mirrored in the distributed chat network. This makes data collection surveys challenging. For example, a significant number of users rely on X/Twitter or Matrix Elements, but the majority reside on Telegram, and even then across multiple Telegram chatrooms and time-zones. The choice to use Telegram was driven by the extra privacy and censorship resistance. Despite three attempts at short (5 question, 5 point Likert-style surveys), there was never a sufficiently broad and fully completed response set to qualify as data discovery. This was tested in two Plebnet Telegram channels, one with +5,000 members and another with +600. Of the users willing to provide information, most responded directly in the chat with direct answers and avoided clicking responses.
Furthermore, it was not possible to provide in-depth information on channel balancing in this manuscript. Fortunately, channel yield is beginning to gain research attention,31 and so channel balancing and channel funding will soon follow. Node management is a topic requiring extensive investigation.
Despite the disappointing conclusion regarding node operator utility preferences, and having spent time in the node operator space, the author can offer the following conclusions which were obtained in response to the attempted survey process:
Even though many operators do experience a USD value loss with respect to labor, and lost access to capital, this does not equate to a bitcoin loss. Specifically, the phrase often heard, is that “₿1 = ₿1.” Node operators, then, think almost solely in terms of Bitcoin. Their primary concern is that they earn more Bitcoin by routing than they spend for rebalancing a channel or purchasing inbound liquidity.
Nodes have a reputation value. Higher ranked nodes can set more restrictive conditions to open a channel, i.e. ₿0.25 minimum to initiate a dual funded channel, and a minimum of 10 open channels. These requirements are public and, following on from this, in the future there may be a market for long established and well-maintained nodes.
Earning 3,000 Sats per month in routing fees while the price of Bitcoin is $1,000 may sound like lunacy, but if one is speculating on the future fiat value of Bitcoin being considerably higher, node operation may still return a fiat financial profit. Time preference is the limiting factor in this arrangement.
In the Bitcoin community, there is significant distrust in fiat and centralized payment systems. Some LN node operators share the “distrust outlook.” and perhaps even typify it. During this study, a paper from the Queensland University of Technology was published, describing people that purchase crypto-currencies as being more likely to hold “dark tetrad” personality traits.21 Rather than rejecting this designation, many node operators added this to their social media biographical descriptions. Similarly, bad news regarding Bitcoin is treated as an opportunity to purchase more, and is not seen as a threat to node operation, only temporarily diminished routing. Node operation does not appear to be a primary means of income for any of the operators described here. A large proportion of node operators are motivated by factors divorced from immediate financial profit. To understand this, rather than attempting a Likert-style study, a focused interview study with qualitative data would almost certainly yield more informative results, and balance the outlook offered by the QUT study.
Finally, the LN is still operating in beta, and as such, there is a lot of tinkering and tuning. This naturally attracts a strong hobbyist undercurrent, which is a strength and weakness of the system. Tuning a node to make it function optimally involves technical competence and computing experience. Novice operators may actually pose a threat to the system if their node is not managed effectively. Operators tend to discuss their successes and failures openly, but the competence gap between new operators, and experienced-hands is considerable.
The author declares that they have no known conflicts of interest as per the journal’s Conflict of Interest Policy.
1 Béres, F., Seres, I. A., Benczúr, A. A. “A Cryptoeconomic Traffic Analysis of Bitcoin’s Lightning Network,” Cryptoeconomic Systems 1.1 (2021) https://doi.org/10.21428/58320208.d4cd697e.
2 Nakamoto, S. “Scalability and transaction rate” Bitcointalk (29 July 2010) https://bitcointalk.org/index.php?topic=532.msg6269#msg6269.
3 Ersoy, O., Roos, S., Erkin, Z. “How to Profit from Payment Channels," arXiv (2019) https://doi.org/10.48550/arXiv.1911.08803.
4 Checkmate and Glassnode, “The Week Onchain (Week 39, 2021)” Glassnode Insights (27 September 2021) https://insights.glassnode.com/the-week-on-chain-week-39-2021/.
5 Georgiadis, E. “How Many Transactions Per Second Can Bitcoin Really Handle? Theoretically.” IACR Cryptology ePrint Archive 416 (2019) https://ia.cr/2019/416.
6 Feng, J. “Bitcoin Is Dead,” (10 August 2022) https://www.bitcoinisdead.org/.
7 Divakaruni, A. and Zimmerman, P. “The Lightning Network: Turning Bitcoin into Money,” Working Paper No. 22-19. Federal Reserve Bank of Cleveland (2022) https://doi.org/10.26509/frbc-wp-202219.
8 Wouters, S. “When Might the Bitcoin Network Process Volumes like Mastercard & Visa?” Blockdata (21 December 2021) https://www.blockdata.tech/blog/general/bitcoin-volume-mastercard-visa.
9 Aysan, A. F., Demirtas, H. B., Saraç, M. “The Ascent of Bitcoin: Bibliometric Analysis of Bitcoin Research.” Journal of Risk and Fiancial Management 14 427 (2021) https://doi.org/10.3390/jrfm14090427.
10 Di Stasi, G., Avallone, S., Canonico, R., Ventr, G. “Routing Payments on the Lightning Network,” in 2018 IEEE International Conference on Internet of Things (iThings) and IEEE Green Computing and Communications (GreenCom) and IEEE Cyber, Physical and Social Computing (CPSCom) and IEEE Smart Data (SmartData), Halifax 1161-1170 (2018) https://doi.org/10.1109/Cybermatics_2018.2018.00209.
11 Khan, N., State, R. “Lightning Network: A Comparative Review of Transaction Fees and Data Analysis,” in Prieto, J., Das, A., Ferretti, S., Pinto, A., Corchado, J. (Eds.) Blockchain and Applications. BLOCKCHAIN 2019. Advances in Intelligent Systems and Computing (2020) https://doi.org/10.1007/978-3-030-23813-1_2.
12 Tikhomirov, S., Moreno-Sanchez, P., Maffei, M. “A Quantitative Analysis of Security, Anonymity and Scalability for the Lightning Network,” in IEEE European Symposium on Security and Privacy Workshops (EuroS&PW) 387-396 (2020) https://doi.org/10.1109/EuroSPW51379.2020.00059.
13 Bartolucci, S., Caccioli, F., Vivo, P. “A Percolation Model for the Emergence of the Bitcoin Lightning Network,” Sci Rep 10 4488 (2020) https://doi.org/10.1038/s41598-020-61137-5.
14 Lin, J.-H., Marchese, E., Tessone, C. J., Squartini, T. “The Weighted Bitcoin Lightning Network,” Chaos, Solitons & Fractals 164 112620 (2022) https://doi.org/10.1016/j.chaos.2022.112620.
15 Zabka, P., Foerster, K. T., Schmid, S., Decker, C. “Empirical Evaluation of Nodes and Channels of the Lightning Network,” Pervasive and Mobile Computing 83 (2022) https://doi.org/10.1016/j.pmcj.2022.101584.
16 De Silva, A., Thakur, S., Breslin, J. “Profitable Fee Controller for Payment Channel Networks,” in Prieto, J., Benítez Martínez, F.L., Ferretti, S., Arroyo Guardeño, D., Tomás Nevado-Batalla, P. (eds) Blockchain and Applications, 4th International Congress . BLOCKCHAIN 2022. Lecture Notes in Networks and Systems 595 (2023) https://doi.org/10.1007/978-3-031-21229-1_9.
17 Hong, H.-J., Chang, S.-Y., Zhou, X. “Auto-tune: An Efficient Autonomous Multi-Path Payment Routing Algorithm for Payment Channel Networks," Computer Networks 225 109659 (2023) https://doi.org/10.1016/j.comnet.2023.109659.
18Jun Ren, A. H., Feng, L., Cheong, S. A., Mong Goh, R. S. “Optimal Fee Structure for Efficient Lightning Networks,” 2018 IEEE 24th International Conference on Parallel and Distributed Systems (ICPADS) Singapore 980-985 (2018) http://doi.org/10.1109/PADSW.2018.8644930.
19 Pedrosa, A. R., Potop-Butucaru, M., Tucci-Piergiovanni, S. “Scalable Lightning Factories for Bitcoin,” in SAC '19: Proceedings of the 34th ACM/SIGAPP Symposium on Applied Computing 302-209 (2019) https://doi.org/10.1145/3297280.3297312.
20 Guo, Y., Tong, J., Feng, C. “A Measurement Study of Bitcoin Lightning Network,” 2019 IEEE International Conference on Blockchain (Blockchain), Atlanta, GA 202-211 (2019) https://doi.org/10.1109/Blockchain.2019.00034.
21 Martin, B. A., Chrysochou, P., Strong, C., Wang, D., Yao, J. “Dark Personalities and Bitcoin®: The Influence of the Dark Tetrad on Cryptocurrency Attitude and Buying Intention,” Personality and Individual Differences 188 111453 (2022) https://doi.org/10.1016/j.paid.2021.111453.
22 van Engelshoven, Y., Roos, S. “The Merchant: Avoiding Payment Channel Depletion Through Incentives,” 2021 IEEE International Conference on Decentralized Applications and Infrastructures (DAPPS) United Kingdom 59-68 (2021) https://doi.org/10.1109/DAPPS52256.2021.00012.
23 Poon , J., Dryja, T. “Lightning Network Whitepaper,” Flashstarts (2015) https://lightning.flashstarts.com/lightning-network-whitepaper/.
24 Obondo, B. “Lightning Network (beta) Launched on Bitcoin Mainnet for the First Time," (2018) Available via The Internet Archive https://web.archive.org/web/20230101022704/https://theblockpro.com/cryptocurrency/bitcoin/lightning-network-beta-launched-bitcoin-mainnet-first-time/.
25 Pickhardt, R., Richter, S. “Optimally Reliable & Cheap Payment Flows on the Lightning Network,” arXiv (2021) https://doi.org/10.48550/arXiv.2107.05322.
26 Pickhardt, R. “Price of Anarchy from Selfish Routing Strategies on the Lightning Network,” BitMEX (26 May 2022) https://blog.bitmex.com/price-of-anarchy-from-selfish-routing-strategies/.
27 BitMEX Research, “The Lightning Network (Part 2) – Routing Fee Economics,” BitMEX (27 March 2019) https://blog.bitmex.com/the-lightning-network-part-2-routing-fee-economics/.
28 No Author, “Real-Time Lightning Network Statistics,” 1ML (2022) https://1ml.com/statistics.
29 No Author, “Amboss,” Amboss (2022) https://amboss.space/.
30 Openoms, “Guides for the RaspiBlitz and Linux Desktop,” GitHub (accessed 6 June 2020) https://github.com/openoms/bitcoin-tutorials.
31 Guasoni, P., Huberman, G., Shikhelman, C. “Lightning Network Economics: Channels,” Michael J. Brennan Irish Finance Working Paper Series Research Paper 21-7 (2023) https://dx.doi.org/10.2139/ssrn.3840374.
32Amboss, “Stats,” Amboss (accessed 15 May 2023) http://amboss.space/stats.
